

You likely won’t be surprised to learn that most prediction market traders lose money over time. Nor that win-loss records tend to be worse among retail accounts than among larger, more sophisticated commercial traders. But now we have a number.
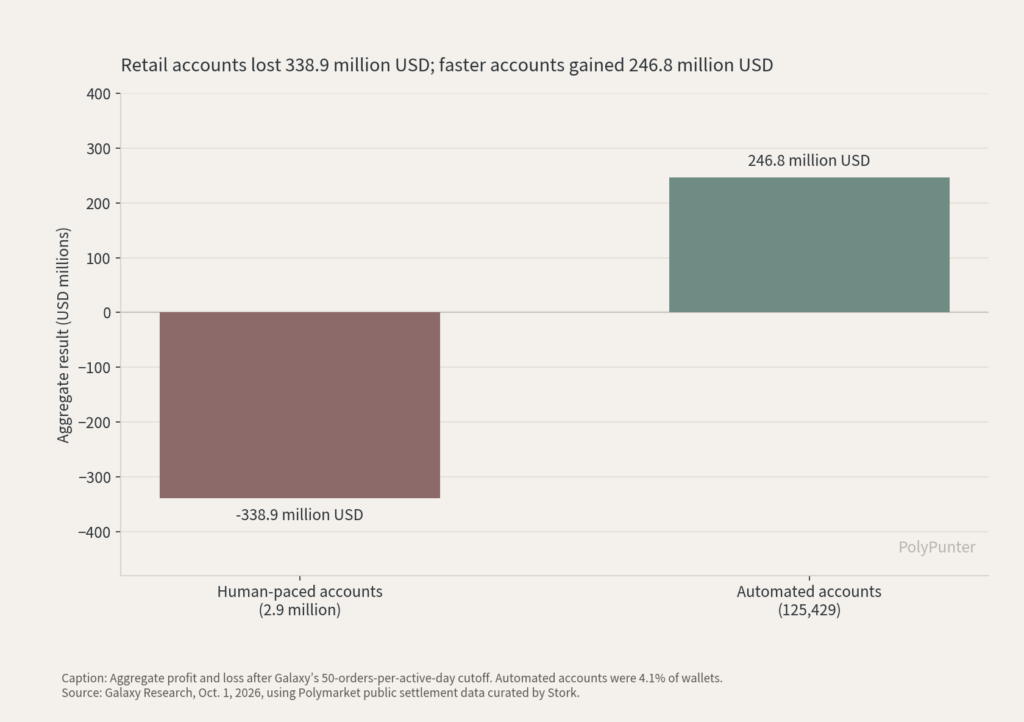
Galaxy Research’s October 1 on-chain study of Polymarket’s international venue says 69.2% of about 2.9 million human-paced accounts finished below break-even. Together, those accounts are down $338.9 million. The median loss is only about $3, so the result is a user-set losing a little, not a mass wipeout.
The record underneath the study is large. Since 2020, the international venue has matched 1.27 billion orders across 3.07 million wallets, worth $82.8 billion in notional volume. This is for Polymarket International and excludes Polymarket US.
How Galaxy defined human-paced accounts
Galaxy filtered accounts for this study, omitting wallets with 50 or more orders per active day, removing 125,429 accounts, or 4.1% of the total. Those high-volume accounts placed 80.8% of orders and 41% of notional volume. But leaving these 4.1% in would have dominated the picture of how the other 96% routinely trade.
The remaining 2.9 million accounts are the retail set. The retail label is based on pace, not wealth. A well-funded trader clicking by hand still counts. Profit is scored at settlement, whether or not the holder redeemed. Worthless positions are often left unclaimed, and counting only redemptions would have hidden most losses.
Wallet addresses are the defining unit. Galaxy cannot reliably tie two addresses to one person, so a trader using several wallets appears as several accounts. That matters when the report talks about traders going quiet after a loss. Wallets go quiet; there’s no way to know whether that means traders are simply using different wallets.
Where the losses sit
Half the retail accounts land between a loss of $36.64 and a gain of $0.40. The edge cases are sharper losses. The first percentile is down $4,804, and the 99th is up $3,381. Per dollar committed, the median account gives up about 0.5%. The tenth percentile loses 90% of what it puts in. Tiny deficits plus a thinner band of large ones produce the $338.9 million cumulative hole for these retail accounts.
The excluded automated accounts finished up $246.8 million. Many of them churn for trading rewards. A smaller number make markets or arbitrage. The two results are not a perfect mirror, but they sit side by side: most accounts lose, while the fast and scaled minority supplies a large share of orders and a net gain.
The data also span a fee change. Polymarket revamped fees earlier in 2026, and some accounts in the study traded entirely before taker fees existed. The 69.2% figure is a full-history count, not solely of the current fee schedule.
What happens after a win or a loss
Winning keeps traders around. Only 6.1% of accounts (wallets) didn’t open another position within 30 days of a win. After a loss, 15.2% did not. A losing account is about 2.5 times as likely to go quiet. Because identity is a wallet, some of that silence may be a fresh address rather than a real exit.
After a win, 46.6% of next positions were larger. After a loss, 50.2% of next positions were larger. Losing entries average $0.43, versus $0.86 for winners, and dollar size rises more easily at low prices. Inside a price band, winners size up more often, especially above 0.50. Below that, wins and losses draw nearly the same response.
Expected downside usually shrinks after either outcome. Traders come back a little smaller than the position that just settled, and they cut back less after a win: 48.4% of post-win positions were riskier than the one before, against 44.7% after a loss. The median change is zero either way. Most traders simply return to the risk level they left.
Specialization and position size
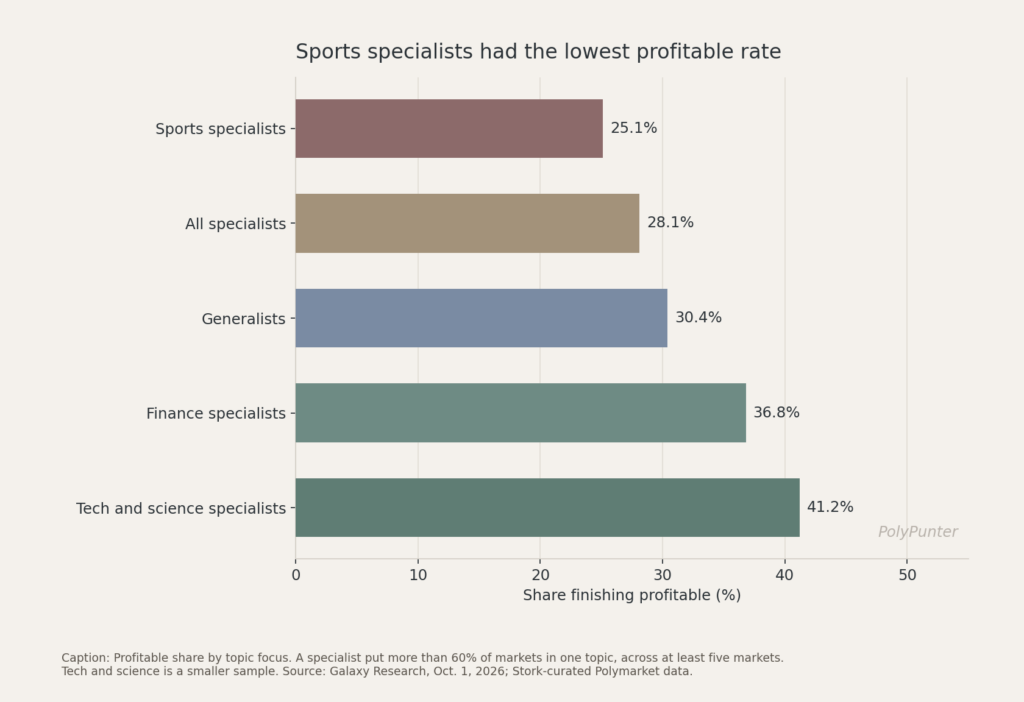
Galaxy calls a trader a specialist if more than 60% of markets traded fall under one topic, across at least five categorized markets. That fits 44.1% of traders. Specialists were profitable 28.1% of the time, compared with 30.4% for generalists, because 61% concentrated on sports, politics, or culture. Outside those three topics, specialists beat the generalist rate, reaching 36.8% in finance and 41.2% in tech and science. The tech sample is smaller.
Sports accounts for 47% of specialists and a 25.1% profitable rate, the worst of any topic. Galaxy’s point is that repeating one hobby is not an edge, and clearly not within sports events. A narrow tech focus can be. Specialists also trade a median of 18 markets, compared with four for generalists, and low-activity accounts default to the generalist group.
Profitable traders take larger positions: a median of $13.96 against $10. The gap holds inside activity bands, including $12.53 against $7.05 for traders with five to nine positions. Holding time does not cleanly sort winners from losers. Pooled medians are about 20 hours for profitable traders and 25 for the rest, but the pattern flips once activity is held constant.
For context on the Galaxy numbers, sports betting apps see about 91-94% of users lose money over time, which far exceeds even the worst-performing cohorts Galaxy examined.
References
- Galaxy Research, “The Behavior of Polymarket Traders: An Onchain Analysis of 2.9 Million Accounts,” October 1, 2026
- Estefano Gomez, “Galaxy Research finds 69% of Polymarket retail accounts lose money,” CryptoBriefing, October 1, 2026
- TokenPost Polymarket coverage, October 1, 2026
- Stork, which curated the settlement data
- Polymarket trading fee documentation
- Robert Nass on X, October 1, 2026, replying to Wu Blockchain’s summary