
Traders Signal Looming Economic Downturns and Tech Layoff Spikes
Prediction markets’ recession odds have rocketed higher in recent sessions. Traders now assign nearly four-in-ten odds to a U.S. economic contraction by the close of 2026. These real-time price movements capture shifting sentiment around oil shocks and geopolitical tensions that traditional forecasters have only begun to digest. Market participants pour capital into contracts that resolve on official GDP data or NBER declarations. They create a living gauge of collective conviction that updates by the minute.
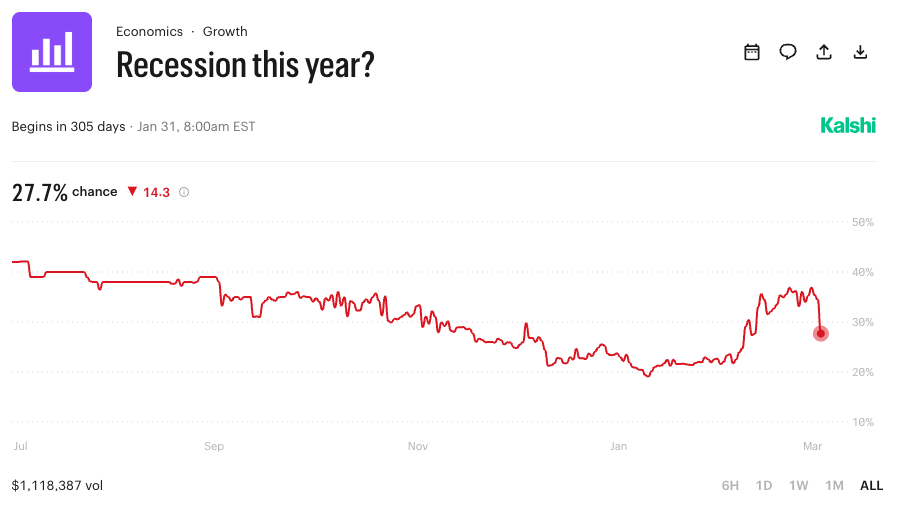
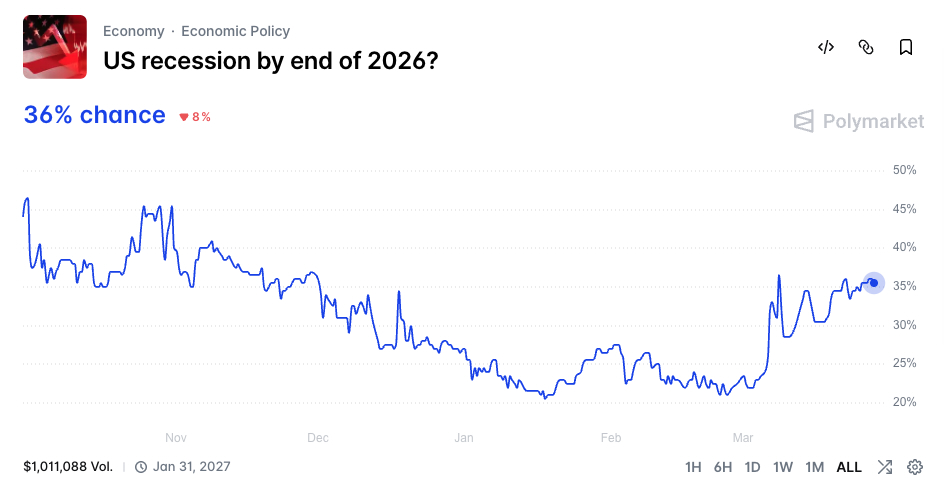
Traders betting heavily on the “yes” side drive the probability to 36 percent on major exchanges. This marks a sharp climb from lower levels weeks earlier. The surge reflects fresh worries over energy prices climbing past $100 per barrel amid Middle East supply disruptions. Participants position themselves ahead of quarterly releases. They turn these contracts into early beacons for portfolio adjustments and corporate planning alike.
Recession Probabilities Climb as Geopolitical Pressures Mount
Active contracts now price a 36 percent chance that two consecutive quarters of negative real GDP growth will hit between mid-2025 and the end of 2026. The Polymarket US recession by the end of 2026 contract trades with $953,555 in volume. Traders adjusting positions in response to oil market volatility push implied probabilities upward with every headline that tightens global supply chains.
Economists tracking these flows note how prediction markets recession odds often diverge from survey-based forecasts by wide margins before converging on reality. The current 36 percent reading sits well above many Wall Street economists’ polls, which hover around 25 to 30 percent. Participants weighing real dollars against possible outcomes generate a forward-looking signal that policymakers and executives increasingly consult before major decisions.
Current Recession Probability Snapshot
| Market Contract | Yes Probability | Trading Volume | Key Resolution Trigger |
|---|---|---|---|
| Two negative GDP quarters or an NBER declaration | 36% | $953,555 | Two negative GDP quarters or NBER declaration |
| Recession This Year (2026 Focus) | 32-40% range (fluctuating) | Multi-million aggregate | BEA data releases through Q4 2026 |
Data compiled from live trading activity demonstrates how quickly sentiment can pivot. Participants locking in positions at these levels bet that external shocks will outweigh resilient consumer spending and corporate earnings resilience. The contracts deliver not just probabilities but also a transparent price-discovery mechanism that reveals the exact dollar value the crowd places on each outcome.
This video breaks down the mechanics behind surging recession odds and shows traders reacting in real time to the latest geopolitical developments.
Tech Layoff Forecasts Heat Up with 87 Percent Odds of Higher Cuts in 2026
Prediction markets’ tech-layoffs contracts reveal intense conviction that job cuts in the information sector will exceed 2025 levels. The flagship “more tech layoffs in 2026 than in 2025” market on Kalshi trades at 87.3 cents for the “yes” outcome. Volume surpasses $13.9 million, underscoring the scale of capital committed to this specific forecast.
Traders monitoring monthly layoff announcements price in elevated risks weeks before major corporations release restructuring plans. The information sector’s layoff rate, tracked in official statistics, serves as the benchmark for resolution, keeping participants honest. High probabilities reflect ongoing efficiency drives, waves of AI automation, and cautious hiring amid uncertain growth prospects.
Tech Layoffs Market Breakdown for 2026
| Contract | Yes Probability | Volume | Resolution Basis |
|---|---|---|---|
| More Tech Layoffs 2026 vs 2025 | 87.3% | $13,979,415 | Exceeds 447,000 layoffs in information sector |
| Tech Layoffs Up in Recent Months | Fluctuating 10-30% monthly | Multi-million aggregate | FRED data on monthly rates |
Market participants scanning these numbers position themselves ahead of earnings calls and regulatory filings that often confirm the very trends priced in days or weeks earlier. The elevated odds capture a sector-wide recalibration that traditional employment surveys have struggled to quantify with the same speed and precision. Executives reviewing these contracts gain an unfiltered view of crowd-sourced expectations that influence everything from talent retention strategies to investor communications.
S&P 500 Streaks Draw Intense Scrutiny Amid Economic Crosscurrents
Prediction markets, economic trends, and contracts indirectly illuminate the durability of S&P 500 winning streaks by pricing broader growth and policy outcomes that sustain or derail equity rallies. Wall Street strategists forecast single-digit to low-double-digit gains for the benchmark index in 2026. Traders betting on recession probabilities simultaneously hedge against streak-ending corrections. Historical patterns show that four-year winning streaks remain rare, and current pricing embeds caution around valuations that sit well above long-term averages.
Participants linking macro contracts to equity performance create layered signals that traditional analysts incorporate into scenario modeling. A sustained streak would require continued earnings expansion and stable interest rates, both of which these markets price in response to fresh data every trading hour. Traders adjusting exposure based on these probabilities effectively vote on whether the current rally can extend into uncharted territory or faces mean-reversion pressures.
Forecast dispersion among major brokerages ranges from conservative 2 percent upside targets to optimistic 17 percent calls. The aggregated market view through related contracts tilts toward tempered optimism tempered by recession risk. The interplay between streak probability and recession odds keeps portfolio managers glued to real-time updates that arrive faster than quarterly outlooks.
AI App Dominance Emerges as a Standout Theme in Forward Bets
Prediction markets, AI dominance contracts, spotlight Claude as the frontrunner for best model by the close of 2026. Traders assign roughly 54 percent implied odds to Claude, followed by Gemini at 25 percent. Monthly “best AI” markets show even sharper swings, with Claude recently commanding high probabilities in short-term windows. Traders betting on application-layer breakthroughs and model performance metrics push volumes into the millions as the technology reshapes productivity across industries.
These contracts capture expectations around AI-native apps that embed directly into consumer and enterprise workflows. They drive forecasts of explosive market expansion. Participants weighing multimodal capabilities, reasoning depth, and deployment speed create a dynamic leaderboard that updates with every benchmark release or product launch. The pricing reflects not hype but capital committed to outcomes that will define competitive edges in software development, content creation, and decision automation.
AI Model Leadership Probabilities at Year-End 2026
| Model | Implied Probability | Recent Shift |
|---|---|---|
| Claude (Anthropic) | 54% | Steady favorite |
| Gemini (Google) | 25% | Modest gains |
| ChatGPT (OpenAI) | 11% | Trailing |
Market participants trading these outcomes expect that dominance in AI apps will translate into tangible revenue streams and user adoption curves that outpace those of legacy software. The contracts serve as a leading indicator for venture funding flows, talent migration, and regulatory attention that follow technological breakthroughs. Traders digesting rapid iteration cycles position themselves ahead of earnings that will validate or refute the current hierarchy.
Analysts in this segment highlight how prediction markets tie recession risks directly to technology investment cycles, which can accelerate or stall depending on economic conditions.
Traders Leverage These Contracts for Macro Signals That Outpace Traditional News Cycles
Prediction markets signal economic trends with remarkable speed because participants commit real capital to outcomes that resolve on verifiable data releases. Macro analysts now cross-reference these probabilities against Federal Reserve communications and corporate guidance to refine timing on rate expectations and capital allocation. The resulting edge emerges from continuous repricing that incorporates dispersed information long before official statistics or analyst notes circulate widely.
Experts following the data flows emphasize how layoff probabilities and recession odds together paint a composite picture that influences everything from hiring freezes to merger activity. Participants updating positions in response to breaking developments create a feedback loop that amplifies visibility into undercurrents that traditional outlets often miss until later. The passion traders bring to these markets stems from the direct profit motive that rewards accuracy and punishes complacency.
Portfolio managers integrating these signals report sharper scenario planning and more nimble hedging strategies that protect against downside while preserving upside participation. The blend of recession, layoffs, equity streaks, and AI dominance contracts forms a comprehensive dashboard that evolves faster than any single research report. Market participants scanning these prices gain an unvarnished read on collective wisdom that shapes investment theses and corporate strategy alike.
References
- 1. US recession by the end of 2026? – Polymarket
- 2. Recession this year? – Kalshi
- 3. More tech layoffs in 2026 than in 2025? – Kalshi
- 4. Best AI 2026: Prediction Market Odds for Claude, Gemini & GPT – Covers.com
- 5. What to expect in 2026: Brokerage forecasts for S&P 500 – Reuters
- 6. US Recession Odds Surge on Prediction Markets – BeInCrypto
- 7. Recession odds in 2026 jump to nearly 40% on prediction markets – Seeking Alpha
- 8. The Prediction Market Everyone’s Talking About in 2026 (YouTube)
- 9. US Issues Recession Alert: Higher Chances In 2026 (YouTube)
The PolyPunter staff works tirelessly to bring you the latest and most insightful news, information, and tips on the fast-growing economic, financial, and social phenomenon that is prediction markets.