
For all the legal, political, and social media news about prediction markets each day, it’s worth considering that the platforms themselves continue to grow skyward. And the institutional investment capital behind them seems incredibly confident about their future.
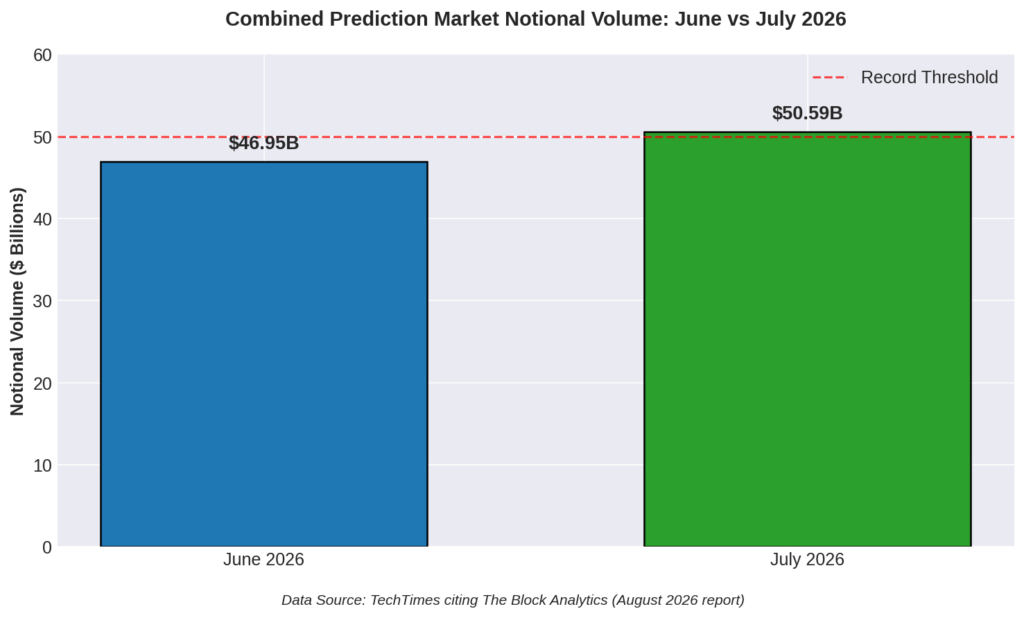
To this point, prediction markets delivered their strongest monthly performance on record in July, with a combined notional volume of $50.59 billion. That total climbed 7.8% above June’s $46.95 billion and arrived as traders kept heavy activity flowing into event contracts well after the World Cup contracts resolved. Data released this week confirms the surge held through the full month rather than fading once the primary volume catalyst ended.
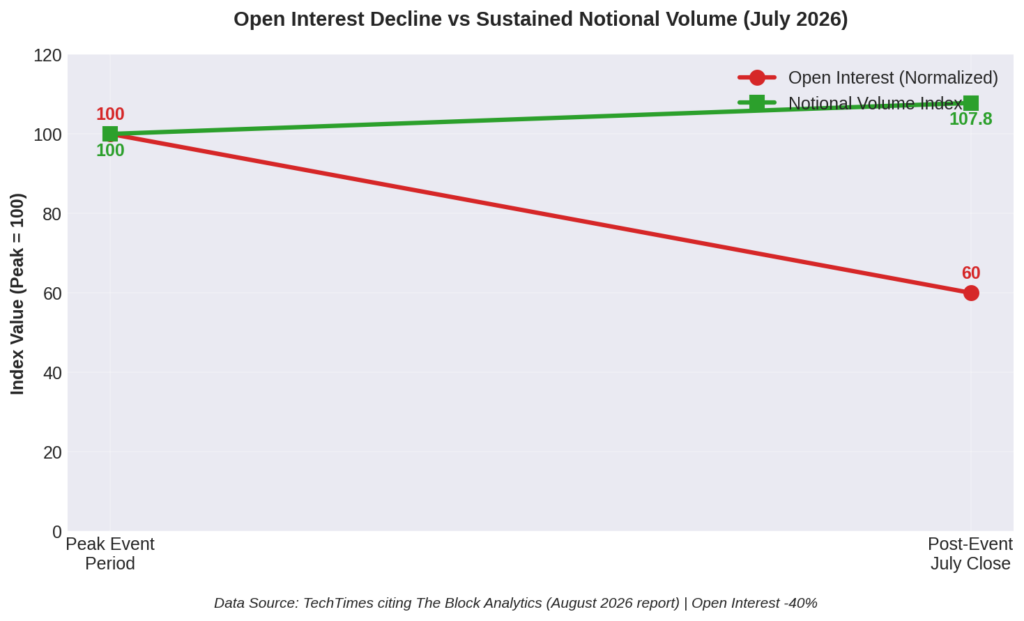
Kalshi accounted for $37.7 billion of the total, securing 74.5% of combined volume and posting both a 14% month-over-month gain and its highest single-month figure ever. Open interest across platforms fell by roughly 40% after peak-event contracts settled, yet daily notional turnover remained elevated. Traders simply recycled capital into secondary and newly listed contracts, preventing any sharp drop in overall activity.
Kalshi Captures Dominant Share of the July Volume Record
Kalshi’s $37.7 billion contribution defined the month. Capturing nearly three-quarters of all reported notional volume, the platform extended its lead while absolute industry totals continued rising. Sports-linked contracts continue to supply the largest share of that flow, though political and other event markets also registered clear increases.
Traders scaled position sizes and shifted into secondary markets as primary ones matured. Market makers absorbed the higher throughput without major dislocations, keeping spreads competitive. Daily notional figures stayed strong through the second half of July, reflecting both higher average daily volume and a wider set of active contracts.
The sequential 14% jump resulted from sustained order flow rather than a single spike. Capital exiting resolved positions moved quickly into fresh opportunities, supporting the platform’s new high. Diversification across categories reduced reliance on any one market and helped lock in the monthly record (though sports markets do continue to dominate).
Residual World Cup Activity Extends the Trading Wave
Residual trading tied to FIFA World Cup event contracts supplied much of July’s fuel. Although the tournament had ended, winner markets, player props, and secondary outcomes continued generating substantial notional volume. Liquidity remained deep enough to handle large tickets, and new contracts referencing post-tournament developments drew incremental flow.
Open interest contracted about 40% once primary markets resolved, yet the decline proved orderly. Positions closed or rolled, freeing capital that migrated into other listed contracts. Daily turnover held firm because new traders entered while existing ones recycled funds, highlighting the difference between outstanding interest and actual trading flow.
Secondary markets linked to individual match statistics extended the volume tail. Traders hunted lingering mispricings after mainstream attention moved on. This extended activity added a measurable lift to the final July total and demonstrated how event-driven waves can persist beyond the main window.
Open Interest Reset and the Road to Future Volume Peaks
The 40% pullback in open interest post-World Cup created a cleaner base for the months ahead. Leverage in the system declined, while notional volume continued to print solid daily numbers. Traders began rotating into contracts tied to upcoming political and economic events, and liquidity providers tightened quotes in response.
November stands as the next potential high-water mark on the calendar. Early contracts for that period are already attracting interest, though current volumes sit well below July levels. Platforms are expanding the markets they offer in preparation for the seasonal increase. Early August readings show activity still elevated relative to historical norms, even if it has stepped back from the July peak.
Crossing $50 billion in a single month resets expectations for prediction market scale. Kalshi’s 74.5% share showed that concentration can coexist with industry-wide growth, even as other platforms recorded absolute gains.
With $37.7 billion already booked by the leading platform alone, the ceiling for monthly totals has moved higher. The July performance supplies a concrete data point on capacity and demand. Traders and platforms now operate against a revised set of industry benchmarks.