
This story was originally posted on the extremely informative Substack of Terry Lee. You should really check out his amazing work and subscribe to his channel.
Introduction
Here is how most people price a parlay on platforms like Polymarket (myself included): Take each leg’s probability, multiply them together.
For example:
- P(A) = 80%
- P(B) = 70%
- P(C) = 60%
Parlay probability = 80% × 70% × 60% = 33.6%
Simple, right?
The issue isn’t the math, it’s the hidden assumptions.
Multiplication assumes each event is independent, meaning the outcome of A tells you nothing about B, but that isn’t the case. For example, (1) what the Fed does at one meeting heavily influences the next, (2) A presidential candidate winning Rust Belt states tells you something about winning Pennsylvania and the subsequent odds of winning the presidential election. In reality, most events worth parlaying are connected. If you ignore that connection, you are most likely overpaying or leaving money on the table.
This article lays out a simple framework for pricing parlays the way traditional finance has priced multi-leg options for decades.
Why do these mispricings exist?
In my opinion, most prediction market tools focus on execution, not correlation analysis. Moreover, these niche markets are relatively nascent, given that parlays are common in sports betting but haven’t matured for niche events yet.
Case study: Fed Rate Decisions
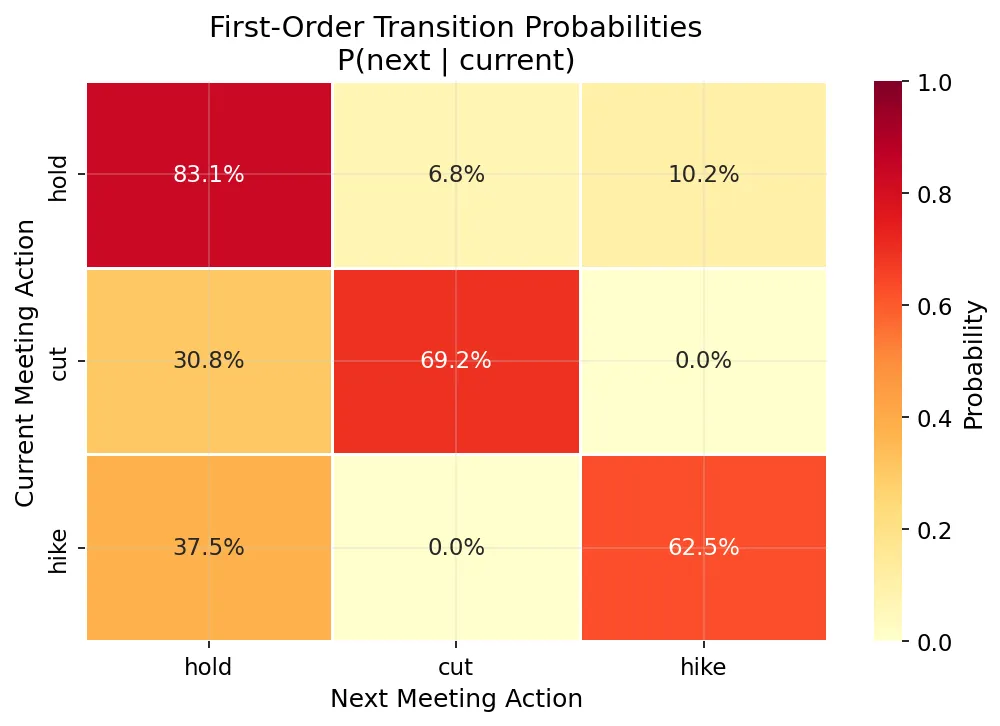
Using FRED data (1994 to early-2026), specifically DFEDTARU & DFEDTAR, I built a transition matrix that pulls what the Fed does in one meeting and the next.
The results are clear:
- Hold to Hold at 83.1%
- Cut to Cut at 69.2%
- Hike to Hike at 62.5%
The Fed clearly operates in streaks. As a forward-looking, data-dependent institution, they tend to repeat the same action until a regime shift. (Read Bond Market if you are interested in learning more!).
How much do they streak?
To test this, I built a model that identifies every consecutive streak (every round of holds, cuts, or hikes in a row).
The results:
- Holds at 32 streaks with an average length of 5.4 meetings.
- Cuts at 12 streaks with an average length of 3.3 meetings.
Next, I simulated 1000 alternate Fed histories with 265 meetings (matching dataset), where each Fed meeting is independent. Where the Fed holds 66% of the time, cuts 15%, and hikes 19%. This mimics the overall sequence as historical data, but with each meeting being an independent flip.
Under independence, Hold streaks averaged 2.9 meetings while Cuts and Hikes streaks averaged ~1.2 meetings each. The values match the theoretical expectation under independence:
Expected streak length = 1 / (1 − base rate)
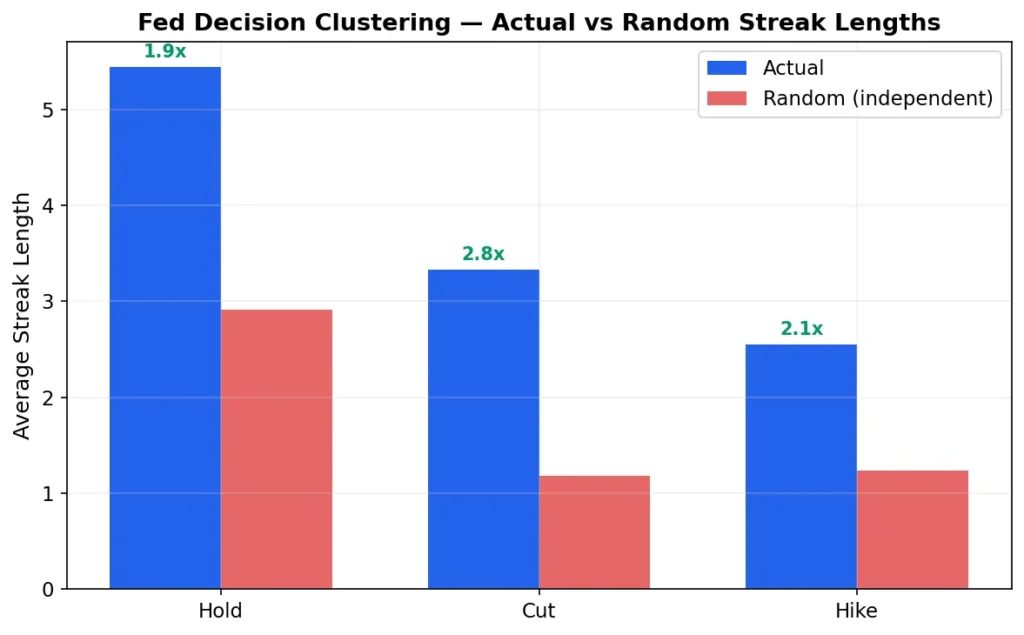
To compare actual and random streak lengths:
- Holds: 5.4 actual vs 2.9 random. 1.9x longer
- Cuts: 3.3 actual vs 1.2 random. 2.8x longer
- Hikes: 2.6 actual vs 1.2 random. 2.1x longer
Notably, cut streaks are nearly three times longer. The reason could be that when the Fed starts cutting rates, it is usually in response to a sustained economic deterioration that doesn’t resolve in one meeting. They cut, reassess, and if the data still looks bad, they will most likely cut again. The same logic applies to holds and hikes, but cuts show the strongest momentum as economic crises can potentially happen suddenly and take time to propagate across the financial markets.
The independence assumption doesn’t just fail slightly as reality produces streaks 2-3x longer than a thousand simulated coin-flipping universes. Anyone pricing a parlay by simple multiplication is ignoring these correlations entirely.
What happens after two meetings?
The first-order matrix shows what the Fed does based on the last meeting, but pricing a three-leg parlay requires going one level deeper, with conditioning on the last two meetings.
The analysis can be divided into two sections.
Staying the course
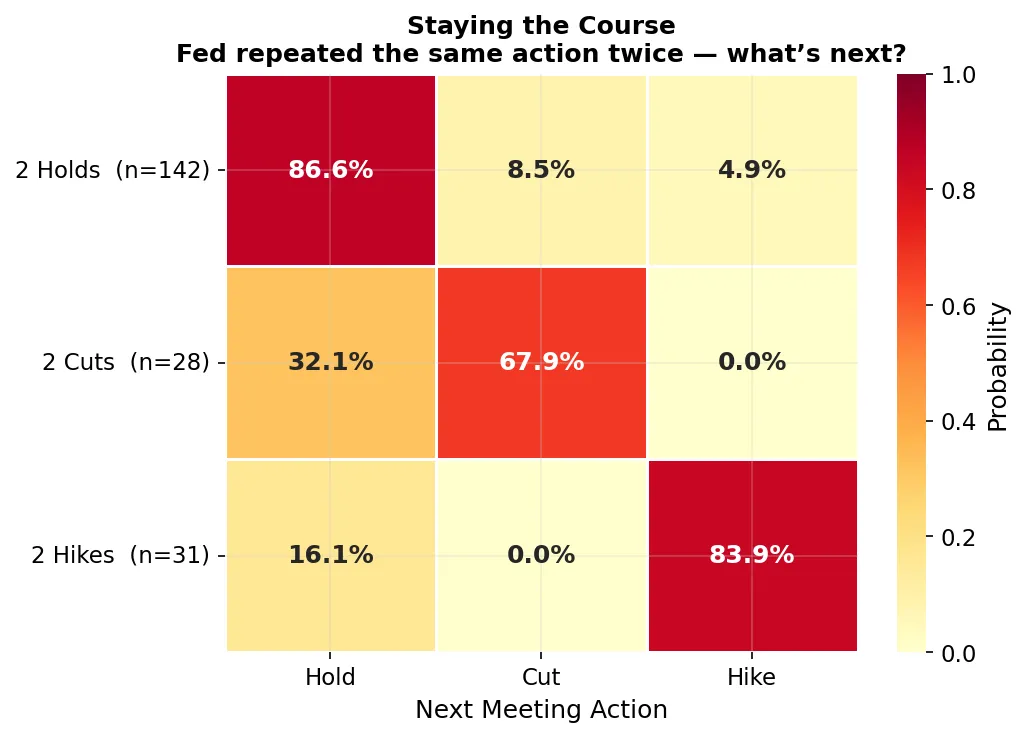
From Diagram 3, it is clear that when the Fed repeats the same action twice, the odds of doing it the third time are overwhelming.
- Two Hold leads to a third Hold by 87%
- Two Hike leads to a third Hike 84%
- Two Cut leads to a third Cut is slightly weaker at 68%
It is also worth noting the 0% cells, the Fed never jumps from 2 Hikes to a sudden Cut or 2 Cuts followed by a Hike suddenly. They always pause first. That alone kills a range of parlays that the naive model would assign positive values to.
After a regime switch
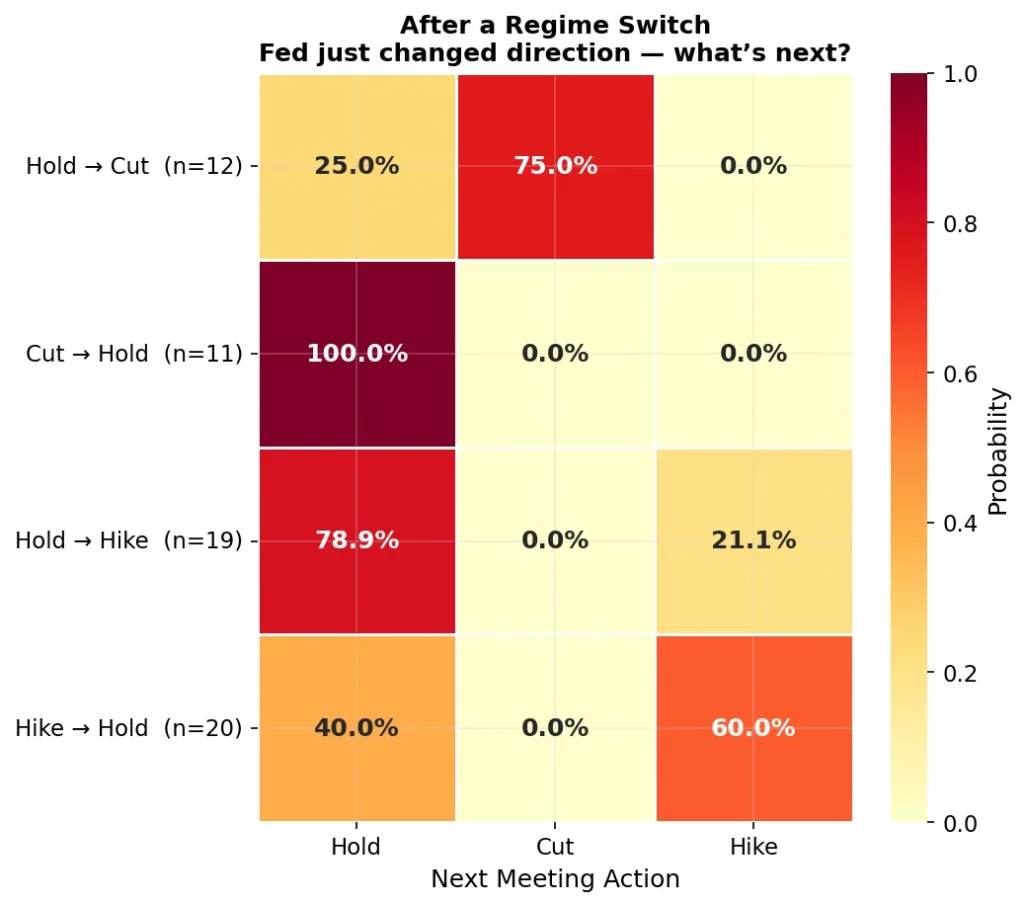
This is where it gets really interesting for traders. Not all direction changes are equal:
- Hold to Cut to Cut odds are at 75%. Once the Fed breaks out of a hold with that first cut, the “floodgates” are open and usually indicate follow-through.
- Cut to Hold to Hold are at 100%. Every single time. A pause mid-easing is a full stop! The Fed has never in recent history resumed cutting immediately after pausing.
- Hold to Hike to Hold at 79%. The first hike after a hold period is tentative; they pause to watch the impact before committing.
- Hike to Hold to Hike at 60% or to Hold at 40%. Unlike the cut to hold, a pause during hiking is genuinely uncertain.
The asymmetry here is the key insight. A “Hold to Cut to Cut” parlay is worth significantly more than naive pricing suggests because that first cut has 75% follow-through. But a “Cut to Hold to Cut” parlay is historically worthless. Same outcomes, different order, completely different values. No model that multiplies independently can capture that.
What does this mean for pricing overall?
Here’s the overall picture. Instead of using blind averages, use the historically observed rates. For example, take a Hold to Hold to Hold parlay. The naive approach uses the overall base rates (67% Hold) for every leg at 67% x 67% x 67% = 30.1%. The corrected approach uses the rates measured:
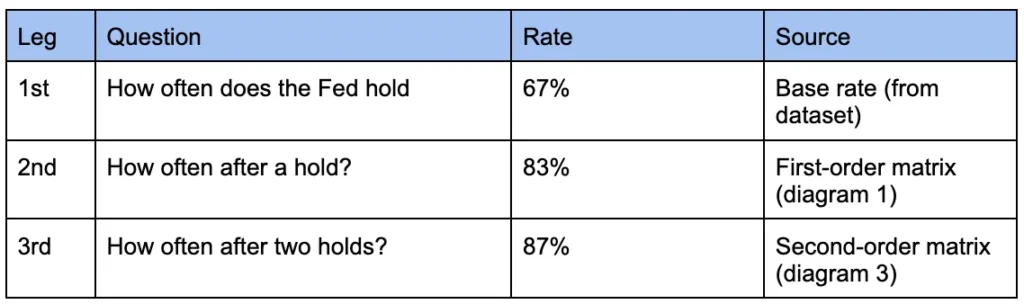
P(Parlay_conditional) = P(Hold A) x P(Hold A | Hold B) x P(Hold C | Hold A, Hold B)
Therefore, 67% x 83% x 87% = 48.4%
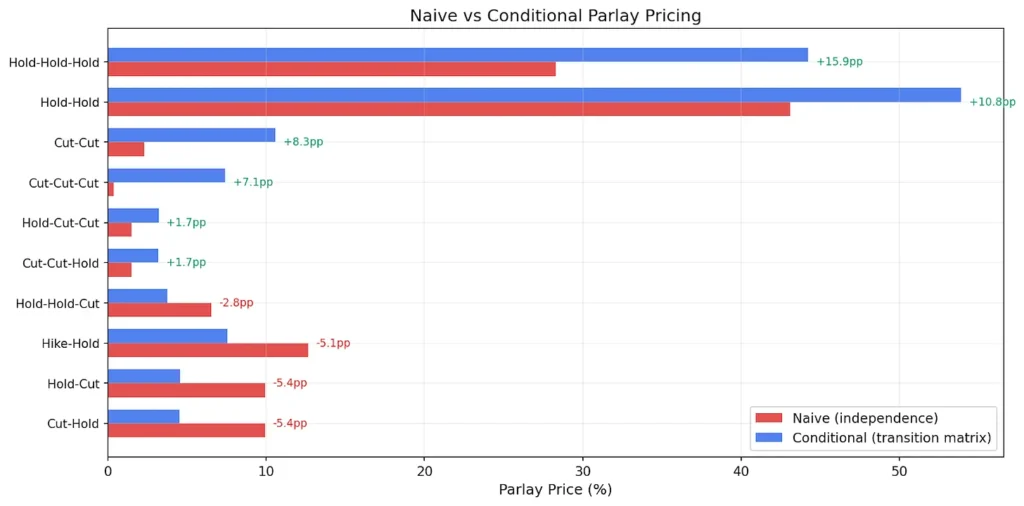
Same-direction parlays (Hold to Hold to Hold as example) are consistently underpriced. Regime switch parlays (Hold to Hold to Cut) are consistently overpriced
Live market check
As seen on Polymarket:
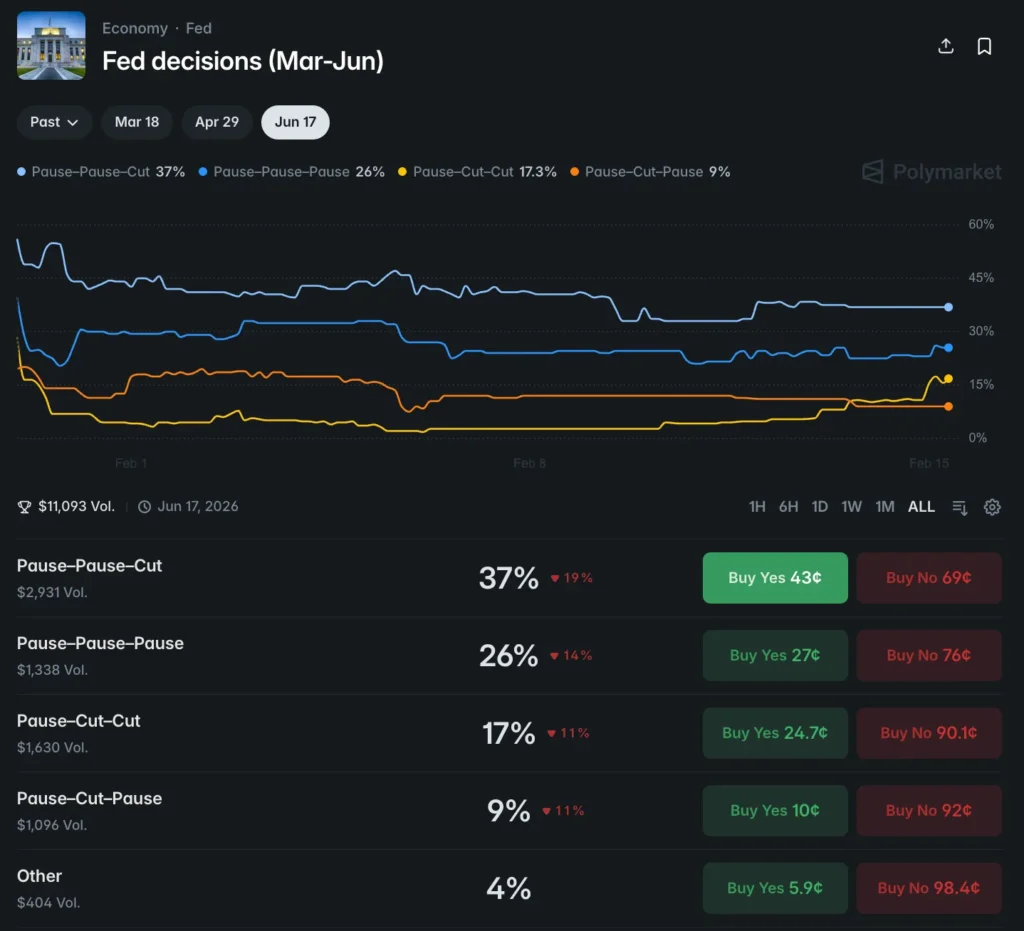
- Pause-Pause-Pause (Underpriced):
Using the naive approach and multiplying the odds for each event independently:
P(Parlay_naive) = P(Hold March) x P(Hold April) x P(Hold June)
P(Parlay_naive) = 93% x 75% x 38% = ~26%
vs.
P(Parlay_conditional) = P(Hold March) x P(Hold April | Hold March) x P(Hold June | Hold March, Hold April)
P(Parlay_conditional) = 87% x 87% x 87% = 65.8%
There is a massive underpricing gap of 39 % percentage points (pp)
- Pause-Pause-Cut (Overpriced)
P(Parlay_naive) = P(Hold March) x P(Hold April) x P(Cut June)
P(Parlay_naive) = 93% × 75% × 49% = 34.2%
vs.
P(Parlay_conditional) = P(Hold March) x P(Hold April | Hold March) x P(Cut June | Hold March, Hold April)
P(Parlay_conditional) = 87% x 87% x 8.5% = 6.4%
Naive parlay is pricing this at ~34%, while using conditional probability is pricing it at 6.4%, which is almost 5x overpriced. To note, the conditional probability model doesn’t say the Fed will never cut. It just prices the sequence but not the destination.
Does this make money?
I backtested a simple test. At every consecutive pair and triplet of FOMC meetings since 1994, if the corrected price is higher (meaning the parlay is underpriced), bet $100 and do this for all outcomes.
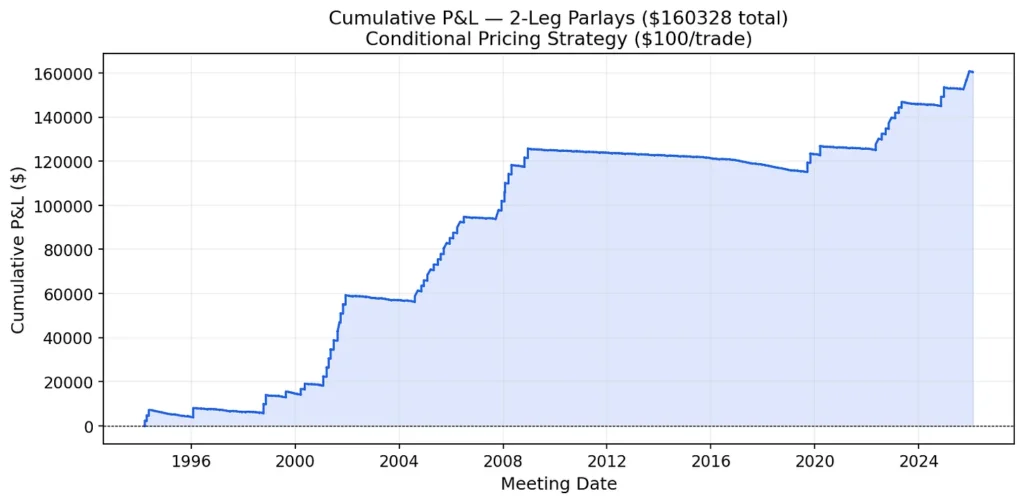
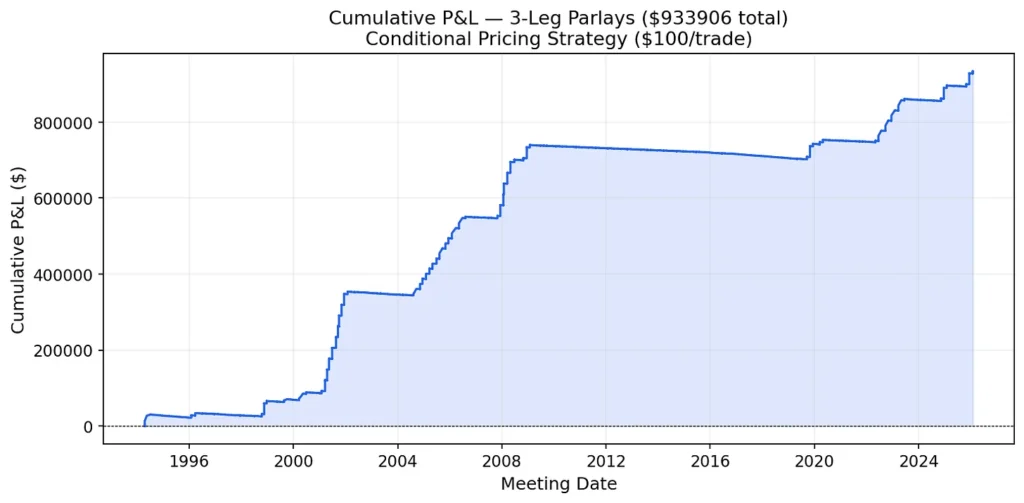
Betting $100 on every underpriced parlay since 1994 would have generated $169k on 2-leg parlays and over $1M on 3-leg parlays. The big jumps correspond to the Fed’s easing cycles in 2001, 2008, 2020 and 2024-2025, where consecutive same-action parlays repeatedly hit.
The staircase shape tells you when the money was made (during sustained Fed action cycles) where the same decision happened meeting after meeting. The naive model kept underpricing the continuation.
However, there is a limitation where transaction costs, getting the relevant price fills and trading Fed events might not have been available in the 1990s to the 2000s within prediction markets.
Beyond the Fed, where else does this apply?
The Fed case study is clean because the data is abundant and the correlation is strong. But the same framework applies anywhere parlay legs are connected:
Presidential nominee elections. If a candidate wins the primary in one state, their odds shift in demographically similar states. A parlay on winning multiple primaries is underpriced by the naive model if those states are correlated and they almost always are.
Crypto and macro or growth stocks. Bitcoin’s price movements are correlated with macro risk sentiment. A parlay on BTC above $X and the Nasdaq above $Y is worth more than the product of the individual probabilities because they share a common driver (risk-on drivers)
In every case, the approach is the same. Look at the historical data, measure how connected the events really are, use those better numbers instead of the blind averages and compare your price to the market. However, in reality, it can be really tough to spot them.
Conclusion
To conclude, prediction markets are still nascent. Most retail participants are pricing parlays the same way people price multi-leg options, by multiplying and hoping for the best.
The framework requires context-specific knowledge but boils down to one question: does the outcome of one leg tell you something about the next? If yes, the naive parlay price is wrong and the historical data will tell you by exactly how much.
The Fed case study shows the edge is real and measurable. But the principle is universal. Anywhere correlated events are being priced as independent, there’s money on the table potentially.
The only question is whether you see it and act on it.
Extracting alpha from prediction markets and crypto! NFA always 🙂
For more great content, check me out on my Substack channel.