An Introduction to Learning Prediction Market Odds and Probabilities
Prediction markets turn real-world uncertainty into tradable assets. Learning how to read odds and probabilities in prediction markets gives you a powerful edge as a new trader. These platforms display prices that directly reflect the crowd’s collective, money-staked forecast for events ranging from elections to economic indicators and sports outcomes. Consequently, mastering implied probabilities helps you evaluate opportunities, avoid common traps, and trade with greater confidence from day one.
Implied probability converts betting odds into the percentage likelihood of an outcome occurring.
Although the numbers may look intimidating at first, the underlying concepts remain straightforward and intuitive. Prediction market prices function as live probabilities because contracts settle at $1 or $0. A glance at any contract price reveals exactly what the market currently believes will happen. This guide breaks everything down step by step so you can decode any market snapshot and start applying these skills immediately, including advanced trading strategies that experienced participants use to generate consistent edges.
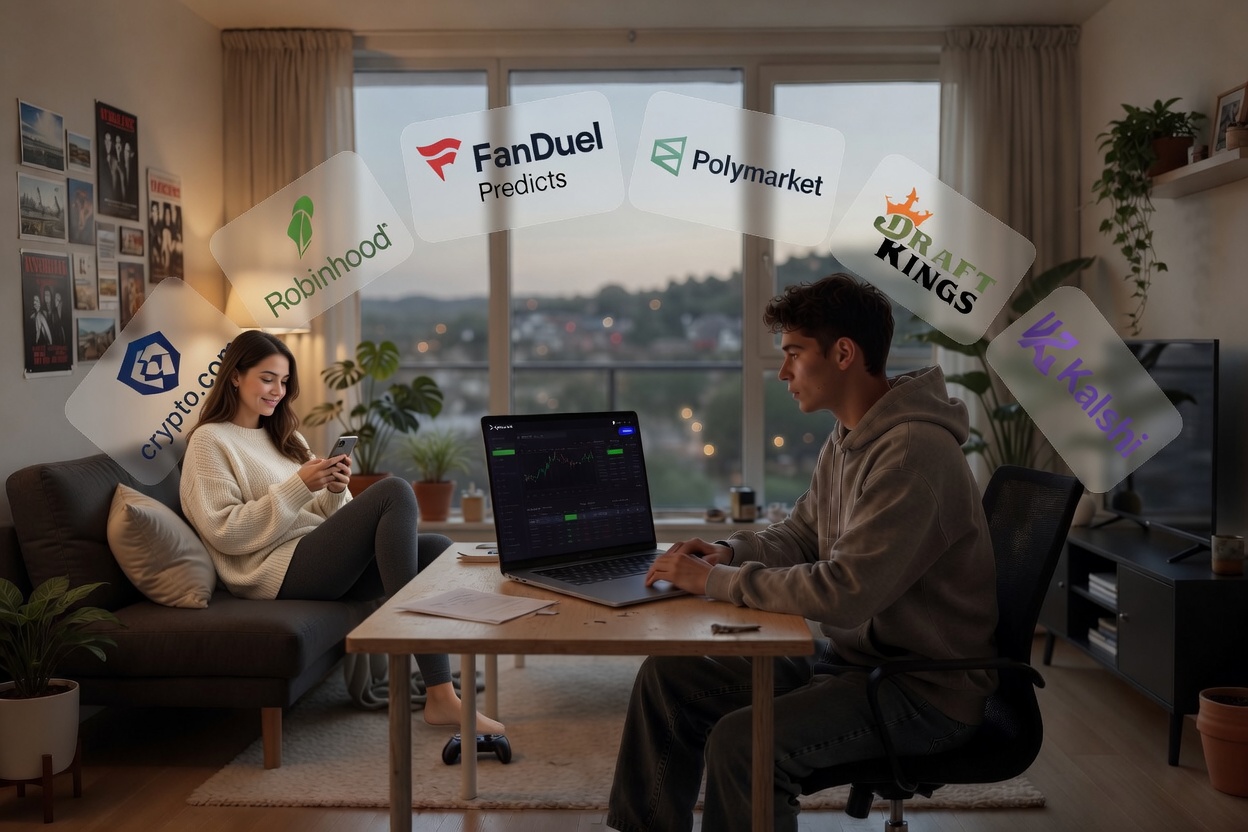
Whether you trade on Polymarket, Kalshi, or other platforms such as Robinhood, Crypto.com, or the new prediction markets from FanDuel and DraftKings, the core principles remain consistent. The techniques here apply across the entire ecosystem and remain relevant as you grow from beginner to experienced prediction market participant.
Why Prediction Market Odds Differ from Traditional Betting Odds
Prediction markets operate on a peer-to-peer model in which participants buy and sell contracts wth one another based on real-world events. Unlike sportsbooks, which take bets on both sides of an event, prediction platforms let prices emerge purely from supply and demand. Consequently, the displayed price translates almost directly into an implied probability.
A Yes contract trading at $0.65 on a prediction market means the market assigns roughly a 65% chance the event will occur. No contracts automatically reflect the complementary probability, often summing close to 100% in liquid markets. Because traders risk real capital, these signals frequently prove more accurate than polls or expert opinions alone.
Liquid markets are a financial environment with high trading activity, allowing assets to be bought or sold quickly, in large volumes, and with minimal price impact, typically featuring tight bid-ask spreads. Key characteristics include many participants, low transaction costs, and high efficiency
While traditional betting odds focus primarily on payouts, prediction market pricing cuts straight to probability, which makes interpretation faster and more transparent for daily use. In addition, prices update continuously as new information arrives, creating a dynamic, living forecast that evolves with the news cycle. In contrast, betting odds only change when reset by the sportsbooks.
Core Principle: Price Equals Implied Probability
On major prediction market platforms, every contract trades between $0.01 and $0.99. This cent value converts instantly into a percentage. A $0.42 Yes share indicates a 42% implied probability of the outcome.
Buyers push prices higher when they believe the true chance exceeds the current level, and sellers drive prices lower when they see overvaluation. As a result, the equilibrium price always reflects the balanced wisdom of active participants at that moment.
However, fees and liquidity can create small temporary gaps that sharp traders monitor closely. The more liquid a market is, the more buyers and sellers and contracts being traded, the more temporary and smaller the gaps will be between buyers and sellers. In less liquid markets, where it’s harder for buyers to find sellers, and vice versa, the listed prices will be less precise.
A sharp trader is a highly skilled, disciplined, and often aggressive market participant who possesses an informational or technological edge, enabling them to exploit inefficiencies faster than the general public.
Think of this real-world example. You want to know if a movie in the theaters is any good. You can ask one friend if they liked it, or read one film review, but that will be less precise than asking one hundred friends, or reading one hundred reviews. Or, as many people do, go to Rotten Tomatoes, where they aggregate a large number of reviews and provide a score. A prediction market with 100 traders will be less precise than a market with 100,000 traders. Sharp traders may trade in less-precise prediction markets, looking for these market imperfections.
Platforms like Polymarket display the midpoint of the bid-ask spread unless the gap widens significantly. Polymarket’s price calculation guide explains that understanding order book dynamics helps you interpret the headline price accurately before entering any position.
Converting Traditional Betting Odds Formats to Prediction Market Probabilities
Although many prediction platforms use simple cent pricing, you will encounter decimal, fractional, and American odds when comparing across sites or with sportsbooks. Learning these conversions lets you spot value discrepancies quickly. Consequently, cross-format fluency becomes an essential skill for serious participants.
American odds show the profit received for a winning bet on either an underdog or a favorite. For example, a +150 on an underdog would mean a bettor wins 1.5 times their bet in profit for an event win. If you bet $100 and win, you would receive back $250 (the $100 you staked plus $150 in winnings). Therefore, a +150 bet would be 100/250 = 0.4 x 100 = 40% implied probability. For a bet on a favorite, for example, the odds might be -200. If you bet $200 and win, you would receive back $300 (the $200 you staked plus $100 in winnings). Therefore, a -200 bet would be 200/300 = 067 x 100 = 66.7% implied probability.
(And yes, American odds are the most complicated odds system, which is why nobody outside the United States uses them.)
Decimal odds show the total return, including the stake. Divide 1 by the decimal figure and multiply by 100 to obtain the implied probability. Example, decimal odds of 2.50 would equal 1/2.50 = 0.4 x 100 = 40% implied probability.
Fractional odds require dividing the denominator by the sum of the numerator and the denominator. American odds are split into positive and negative cases, each with its own formula. Because these calculations become automatic with practice, you will compare opportunities across ecosystems without hesitation. Example, fraction odds of 3/2 = 2 (the denominator) / 5 (the sum of the numerator and the denominator) = 0.4 x 100 = 40% implied probability.
Prediction markets rarely embed the bookmaker’s overround, so their implied probabilities often appear cleaner and more efficient. As a result, many traders use them as a benchmark when evaluating lines elsewhere. Investopedia’s betting basics guide provides excellent context on these formats.
Odds calculators often help if you wish to skip doing any of this by hand.
Odds Conversion Reference Table
| American Odds | Decimal Odds | Fractional Odds | Implied Probability | Prediction Market Price |
|---|---|---|---|---|
| +150 | 2.50 | 3/2 | 40% | $0.40 |
| -200 | 1.50 | 1/2 | 66.7% | $0.67 |
| +300 | 4.00 | 3/1 | 25% | $0.25 |
| -110 | 1.91 | 10/11 | 52.4% | $0.52 |
| +500 | 6.00 | 5/1 | 16.7% | $0.17 |
These equivalencies, drawn from standard betting math resources, help traders translate signals rapidly.
Step-by-Step Calculation of Implied Probability in Prediction Markets
Calculating implied probability from prediction market prices stays remarkably simple. Multiply the contract price by 100 to convert cents directly into a percentage. Therefore, $0.58 instantly equals a 58% implied chance.
From a risk-reward perspective, buying a yes contract at $0.30 means you risk 30 cents to receive 100 cents, if correct, or a profit of 70 cents. This 30% probability view pairs naturally with the payout structure and sharpens expected value assessments. Kalshi’s probability guide emphasizes this dual lens for better decision-making.
Although formulas for traditional odds require extra steps, prediction market pricing eliminates complexity. Consequently, beginners focus energy on research and event analysis rather than mental math.
However, always read and verify the resolution criteria, how Yes and No are determined for closure, because even a correctly forecast probability can be resolved against you on technical grounds.
Resolution criteria will always be listed alongside the prediction market. Read it!
Prediction Market Price to Probability Quick Reference Table
| Market Price | Implied Probability | Risk-to-Win Ratio (Yes) | Typical Market Interpretation |
|---|---|---|---|
| $0.10 | 10% | Risk $0.10 to win $0.90 | Highly unlikely long shot |
| $0.30 | 30% | Risk $0.30 to win $0.70 | Underpriced possibility |
| $0.50 | 50% | Risk $0.50 to win $0.50 | Maximum uncertainty zone |
| $0.70 | 70% | Risk $0.70 to win $0.30 | Strong favorite |
| $0.90 | 90% | Risk $0.90 to win $0.10 | Near-certainty with limited upside |
Resources like Sigma’s analysis classify ranges to guide sentiment reading at a glance.
Reading Live Examples and Order Book Dynamics
Imagine a contract asking whether interest rates will fall by a certain date. If Yes, shares trade at $0.58 with a tight bid-ask spread; the market prices in a moderate 58% likelihood. Because liquidity remains strong, the displayed midpoint reliably reflects consensus.
The bid-ask spread is the difference between the highest price a buyer is willing to pay (bid) and the lowest price a seller is willing to accept (ask) for an asset. It represents a key measure of market liquidity and acts as an indirect transaction cost for traders, where a narrower spread indicates higher liquidity and lower costs
Now, suppose fresh economic data hits the news wires and social media, affecting interest rates. Prices might jump on Yes contracts from $0.45 to $0.62 within minutes as participants react. Consequently, early buyers realize quick profits (if they sell at the new, higher price) while newcomers reassess their own estimates of the Yes against the updated signal.
Watching volume alongside price movement distinguishes conviction-driven shifts from low-participation noise.
In thinly traded contracts, wide spreads warn of execution risk. A headline price of $0.22 may only fill at $0.19 or $0.25, depending on the side. Therefore, checking order book depth before committing capital prevents slippage surprises.
It may be that beginners want to get their feet wet in liquid markets, where there are many active buyers and sellers and high trading volumes.
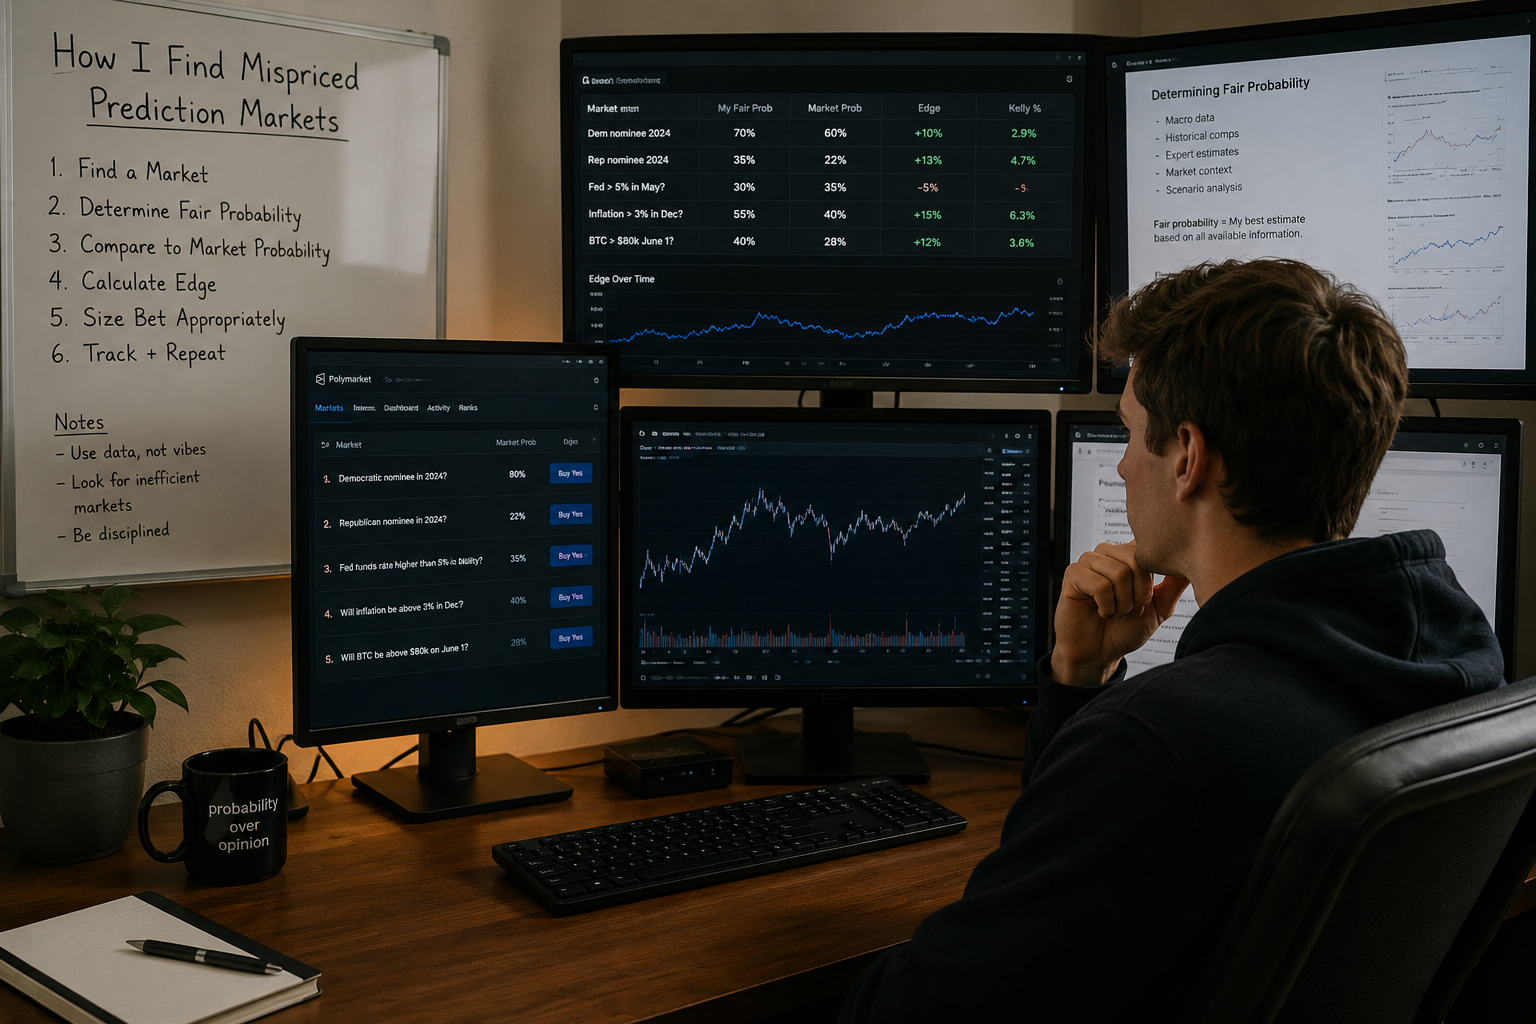
Identifying Value When Your Probability Estimate Differs from the Market
Value appears whenever your independent assessment diverges meaningfully from the current price. If you calculate a 72% true probability, yet the contract trades at $0.55, buying yes shares offers a positive expected return across repeated similar situations. However, sustained edges require disciplined research that consistently beats crowd wisdom.
And here is a time to note: as with any forecasting or betting, much of the time you see a window between what the event contract on the prediction market is trading at and what you think it ought to be, you will be proven wrong. This is entirely speculation. It’s worth assessing, Why Do I Know More Than The Market on This Topic or Event? If you don’t have an answer to that question, you can still win, but you are blindly gambling.
Here’s a PolyPunter article revealing that music artist superfans, who live and breathe their artists, know more than most about them and are winning in prediction markets on their artists:
Comparing the same event across platforms often reveals temporary inefficiencies. Although fees and liquidity vary, large gaps create arbitrage or hedging setups worth exploring. In addition, converting prediction market prices to American odds equivalents helps sports bettors instantly spot cross-market opportunities.
Arbitrage is the simultaneous purchase and sale of an asset in different markets to profit from a temporary price difference. It is a low-risk or risk-free strategy that exploits market inefficiencies, allowing traders to buy at a lower price in one market and instantly sell at a higher price in another.
Yet chasing every apparent discrepancy leads to overtrading. Prices near extremes (like buying Yes contracts at 98 cents where the profit from a win is very small) carry asymmetric risk-reward profiles, so position sizing must adjust accordingly. As a result, combining probability reading with strict bankroll rules produces more consistent long-term results.
A note about arbitrage: because the profits from arbitrage are low, even if certain, the only way to earn substantial profits is by buying a substantial position. If you earn 1% on arbitrage after fees, going to the effort to earn $1 off $100 in trading likely doesn’t make sense. If you’re investing millions of dollars, perhaps it does. But prediction platforms are getting smarter about arbitrage and are starting to share information to prevent it (as sportsbooks have been doing for some time now).
Advanced Trading Strategies Using Odds and Probabilities
Once you master reading probabilities, advanced strategies transform raw insights into repeatable profits. These approaches build directly on implied probability analysis and help experienced traders exploit inefficiencies while managing risk. Consequently, moving beyond basic value spotting unlocks higher consistency and scalability.
Value Betting with Edge Quantification remains foundational. When your estimated probability exceeds the market-implied probability by a meaningful margin (typically 5-10% or more after fees), you hold a positive expected value (+EV) opportunity. Traders calculate edge as (Your Probability × Decimal Payout) – 1. Positive results signal action. Because this formula quantifies advantage precisely, it prevents emotional decisions and focuses capital on the strongest setups.
In summary, buy into prediction markets when you think they are clearly underselling (or overselling) the real likelihood of the event being forecast, especially so if you think that gap is large. Smaller gaps may be lost to fees, and the risk-reward balance may not be in your favor.
Expanding the Kelly Criterion for Optimal Position Sizing
The Kelly Criterion stands as one of the most powerful mathematical tools for determining exactly how much of your bankroll (the total amount of money you have set aside to put at risk on all trades) to allocate to each trade.
This section gets heavier into the mathematics of wagering, but it is worth a read if you’d like another strong strategy for maximizing returns.
Developed by John L. Kelly Jr., this formula maximizes the long-term geometric growth rate of your capital while avoiding ruin, assuming you hold an edge. In prediction markets, the adapted formula becomes f* = (b × p – q) / b, where f* is the optimal fraction of your bankroll to wager, p equals your estimated true probability of the event occurring, q equals 1 – p, and b equals the net odds received, calculated as (1 – market price) / market price.
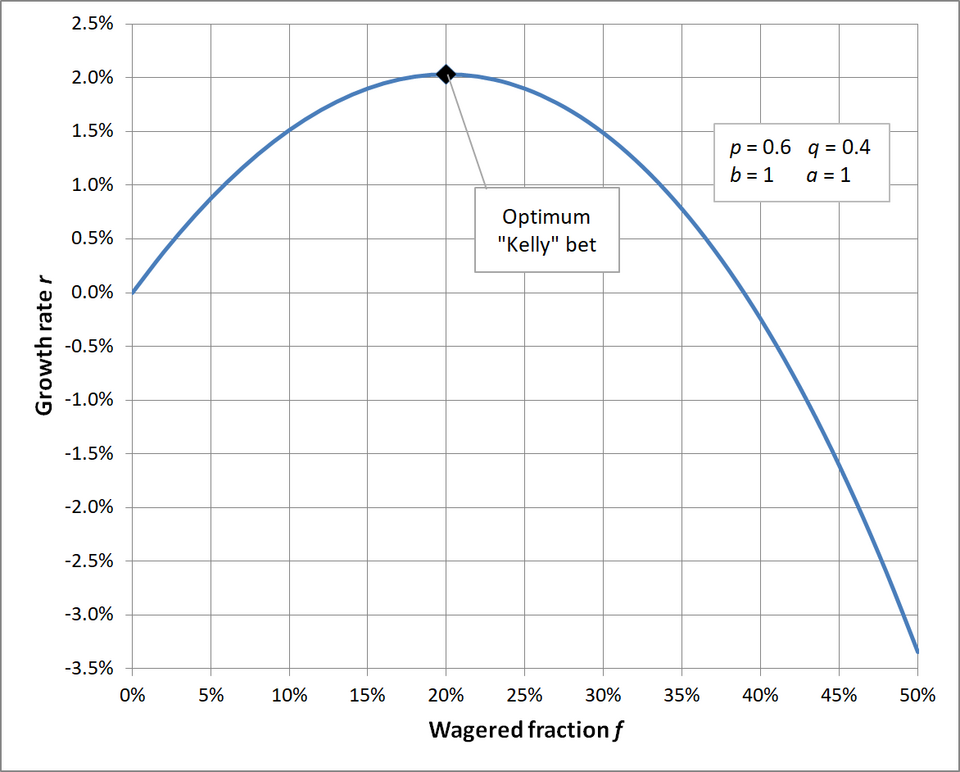
Consider a practical example on a major platform. A Yes contract trades at $0.60, implying a 60% market probability. After thorough research, you assess the true probability to be 75%. First, compute b = (1 – 0.60) / 0.60 = 0.667. Then plug into the formula: f* = (0.667 × 0.75 – 0.25) / 0.667 ≈ 0.375, or 37.5% of your bankroll. This allocation aggressively compounds growth when your edge proves correct over many trades, yet it assumes perfect accuracy in your probability estimates.
Full Kelly betting proves extremely volatile in practice because it assumes you never overestimate your edge. Professional prediction market traders, therefore, rely on fractional Kelly betting, most commonly half-Kelly or quarter-Kelly, to reduce drawdowns dramatically while still capturing the majority of long-term growth. Half-Kelly in the example above would suggest allocating about 18.75% of the bankroll, which sharply reduces variance and protects against losing-trades sequences or occasional miscalibrations in probability. As a result, this conservative adjustment allows sustainable compounding even when real-world conditions deviate from ideal mathematical assumptions.
Always recalculate Kelly after every trade because your remaining bankroll changes. Combine it with strict overall portfolio limits, never exceeding 20-25% total exposure across correlated events, to prevent catastrophic drawdowns.
Tracking your historical calibration (how often your probability estimates match actual resolutions) further refines the inputs and improves results over time. Consequently, the Kelly Criterion turns probability reading from an academic exercise into a precise capital-growth engine. Detailed explanations can be found in resources such as Navnoor Bawa’s math of prediction markets and Better Edge’s Kelly guide.
Detailed Kelly Criterion Examples Table
| Market Price | Market Implied Prob. | Your Estimated Prob. | Net Odds (b) | Full Kelly % | Half Kelly % (Recommended) | Quarter Kelly % (Conservative) | Edge Interpretation |
|---|---|---|---|---|---|---|---|
| $0.60 | 60% | 75% | 0.667 | 37.5% | 18.8% | 9.4% | Strong edge – high confidence undervaluation |
| $0.45 | 45% | 60% | 1.222 | 27.3% | 13.7% | 6.8% | Moderate edge in undervalued mid-range contract |
| $0.25 | 25% | 40% | 3.000 | 20.0% | 10.0% | 5.0% | Excellent long-shot value with high reward potential |
| $0.82 | 82% | 90% | 0.220 | 44.4% | 22.2% | 11.1% | Small but reliable edge on heavy favorite |
| $0.35 | 35% | 48% | 1.857 | 15.1% | 7.6% | 3.8% | Modest edge requiring careful sizing |
These real-world style examples illustrate how the Kelly percentage scales with edge strength. Notice how stronger edges (larger gaps between your probability and the market’s) justify larger allocations under full Kelly. Still, professionals almost always use fractional versions for safety. Additional guidance is available in Tenki’s Kelly Criterion overview.
Additional Kelly Criterion Worked Examples
Example 1: Strong Edge on Election Contract — A presidential election winner contract trades at $0.55 (55% implied). You believe the true probability is 68% after reviewing state polls and turnout models. Net odds b = (1-0.55)/0.55 ≈ 0.818. Full Kelly = 23.9%. Half Kelly recommends betting roughly 12% of your bankroll. This balanced approach lets you compound capital steadily while surviving variance.
Example 2: Long-Shot Opportunity — A niche regulatory approval contract sits at $0.18. Your analysis of upcoming hearings and lobbying data puts the true chance at 32%. Net odds b = 4.556. Full Kelly suggests 17.8% allocation. Quarter Kelly (4.45%) becomes prudent here because low-probability outcomes carry high variance even with an edge.
Example 3: High-Probability Caution — A contract trading at $0.88 implies strong consensus. You assess 94% true probability. The edge is small (b=0.136), yielding a full Kelly of 38.2%. Because upside remains limited and a black-swan reversal could hurt, most traders cap exposure at quarter-Kelly (9.6%) or less.
Cross-Platform and Combinatorial Arbitrage exploits pricing mismatches. Buy undervalued yes on one platform while selling equivalent exposure on another, or construct portfolios across related contracts that guarantee profit regardless of outcome when summed prices fall below $1.00. Volatility arbitrage in short-term markets, such as buying both sides of rapidly moving events when the combined cost stays under $0.95, locks in small but reliable edges. Although these strategies require fast execution and careful resolution checking, they deliver low-risk profits rooted in probability divergences. Alphascope’s Polymarket odds breakdown offers further insight into how to spot these opportunities.
Contrarian Sentiment and Liquidity Provision offer additional layers. When crowd panic pushes probabilities to extremes unsupported by fundamentals, fading the overreaction produces outsized returns. Providing liquidity in moderately thin markets by placing tight limit orders repeatedly captures the bid-ask spread. Meanwhile, monitoring order book depth alongside shifts in probability reveals hidden conviction or manipulation risks before committing larger capital.
These advanced methods demand rigorous record-keeping and continuous calibration of your probability estimates against actual resolutions. Therefore, integrating them gradually while maintaining small position sizes during the transition phase builds long-term proficiency without excessive risk. Phemex Academy provides additional context on probability-based trading approaches.
Advanced Interpretation Techniques for Price Movements
Beyond static readings, dynamic price action reveals shifting sentiment. Rapid upward moves often follow credible news catalysts, while gradual drifts indicate building consensus. Therefore, overlaying volume and news timelines helps separate signal from temporary hype.
When you see a prediction market with spikes, up or down, ask yourself, are traders responding reactively to breaking news, or are they responding to true changes in the underlying probabilities of the event outcome?
Bid-ask spreads tighten in highly liquid markets, delivering trustworthy midpoints. Wide spreads, conversely, demand caution because actual entry prices differ from the displayed figure. Moreover, comparing implied probabilities against external benchmarks like polls or econometric models highlights potential edges worth investigating.
Common Mistakes Beginners Make When Reading Prediction Market Probabilities
Many new traders treat a 75% probability as near certainty and overlook the meaningful 25% chance of the alternative outcome. Because tail events do materialize, overbetting on high-probability contracts can lead to painful drawdowns when surprises occur. Consequently, conservative position sizing remains vital regardless of how attractive the numbers appear.
Phemex Academy and similar resources classify probabilities into low, mid, and high tiers to structure interpretation. Mid-range contracts around 40-60% invite the most active debate and trading volume, creating fertile ground for informed participants.
Another frequent error involves ignoring fees, slippage, and resolution details. Although a contract shows $0.60, real entry and exit prices, along with platform costs, can erode or eliminate edges in smaller markets. In addition, chasing momentum without independent verification often leads to buying at peaks, only to be hit by sharp corrections.
Slippage is the difference between the expected price of a trade and the actual price at which it is executed, often occurring during high volatility, low liquidity, or rapid market movements. It commonly affects stocks, crypto, and foreign exchange, resulting in a less favorable price for the investor
Traders sometimes neglect liquidity entirely. However, low-volume contracts remain vulnerable to manipulation or extreme volatility. Therefore, sticking primarily to high-volume markets during the learning phase builds skills safely as you refine your ability to interpret prediction market implied-probability signals.
Practical Tips and Strategies to Apply These Skills Right Away
Begin by paper trading (placing hypothetical trades) on several prediction market contracts while practicing conversions daily. Track your personal probability estimates against actual resolutions to calibrate accuracy over time. Because consistent journaling dramatically speeds improvement, document your reasoning for every decision you make. Think of this as practice games and warmups before the real game.
Use free online converters until mental math becomes automatic. Meanwhile, revisit live prediction markets multiple times daily to observe reactions to headlines. Consequently, pattern recognition develops quickly through active engagement rather than passive study alone.
Compare identical events across different platforms when available. Although minor differences arise from fees or user bases, significant gaps often flag actionable value. In addition, reviewing historical accuracy reports published by leading sites reinforces trust in the probability mechanism.
Remember that single trades rarely define success. Because prediction markets reward process and edge over dozens or hundreds of decisions, focus on repeatable habits and let probabilities compound in your favor.
What are the prediction market sectors and questions where I am consistently correct and where I am consistently wrong? You’d be surprised how many people never ask this basic question or even know the answer.
Putting It All Together: Your Next Steps in Prediction Markets
Armed with clear techniques for reading odds and probabilities plus advanced strategies, you can now approach any prediction market with purpose and clarity. Prices transform from mysterious figures into actionable, probability-backed forecasts. Therefore, the next contract you open will feel familiar and full of potential insight.
Whether hunting undervalued probabilities or constructing sophisticated arbitrage portfolios, these skills deliver repeatable advantages. As a result, beginners rapidly evolve into confident traders who navigate volatility with informed precision rather than guesswork.
Prediction markets continue to expand because they harness collective intelligence in ways that traditional forecasting rarely matches. By mastering “how to read odds and probabilities in prediction markets”, you join a vibrant community that turns information into tradable insights. Start small, practice consistently, and watch your forecasting edge sharpen with every market and contract you analyze.
Frequently Asked Questions About Reading Odds and Probabilities in Prediction Markets
What does a contract price like $0.65 actually mean in prediction markets?
In prediction markets, a Yes contract trading at $0.65 directly signals a 65 percent implied probability that the event will occur. Because shares pay out $1 if the outcome resolves Yes and $0 if No, the current price reflects the collective belief of all active traders at that moment. Consequently, this straightforward relationship lets you instantly translate any market snapshot into a real-world forecast without extra math. As prices update in real time with new information, they create a living picture of shifting expectations that feels both dynamic and reliable.
How do I convert traditional betting odds into implied probabilities?
Start by identifying the odds format. For decimal odds, divide 1 by the number and multiply by 100. Fractional odds require dividing the second number by the sum of both numbers before multiplying by 100. American odds split into two formulas depending on the plus or minus sign, yet all three formats convert cleanly into the same percentage chance the market implies. Once you master these quick steps, comparing prediction market prices with bookmaker lines becomes second nature and reveals hidden opportunities across platforms.
Why do prediction market prices often differ from traditional sports betting odds?
Prediction markets price contracts purely on probability through open supply and demand, whereas bookmakers build in a profit margin called the overround or bookmaker’s margin. As a result, prediction market prices usually sum neatly to 100 percent across Yes and No sides, delivering cleaner signals without hidden house edges. Meanwhile, traders push prices up or down based on real money convictions, creating a more accurate crowd wisdom that updates faster than fixed bookmaker lines. This fundamental difference explains why many experienced participants trust prediction markets for sharper forecasting.
How can I spot value when my own probability estimate differs from the market price?
Value appears whenever your researched probability sits meaningfully above or below the displayed market price. For instance, if you assess a 68 percent chance but the contract trades at $0.55, buying Yes shares offers a positive expected return over repeated similar trades. Because markets incorporate diverse information, these divergences often highlight overlooked factors or temporary inefficiencies. Still, consistent edge only materializes when your reasoning proves stronger than the crowd’s collective judgment over time.
What are the most common mistakes beginners make when reading odds and probabilities?
Many newcomers treat a 75 percent probability as near certainty and ignore the remaining 25 percent chance of the opposite outcome. Others overlook trading fees, slippage, or wide bid-ask spreads that quietly erode potential profits in smaller markets. Additionally, chasing rapid price momentum without verifying fundamentals leads to buying at inflated levels that later correct sharply. Consequently, experienced traders always combine probability reading with independent research and strict position sizing to avoid these costly pitfalls.
Why does liquidity matter when interpreting live market prices?
Liquid markets feature tight bid-ask spreads and high trading volume, so the displayed price reliably matches what you can actually buy or sell at that moment. In thinly traded contracts, however, a single large order can swing the price dramatically, making the headline number less trustworthy. Therefore, checking volume and spread depth before committing capital prevents unpleasant surprises and ensures your probability reading aligns with executable trades. As a result, beginners build skills faster by focusing on high-volume events during the early learning phase.
How should beginners practice reading odds and probabilities effectively?
Begin by paper trading (hypothetical trading) a handful of contracts while converting prices to probabilities several times each day until the math feels automatic. Track your own estimates against final resolutions in a simple journal to calibrate accuracy over weeks. Meanwhile, revisit the same live markets multiple times daily to watch how prices react to breaking news. Because consistent practice turns abstract numbers into intuitive insights, you will soon approach every new market with clarity and confidence rather than confusion.
References
- Polymarket Documentation
- Polymarket Help Center
- Kalshi Probability Guide
- Sigma Analysis
- Investopedia Betting Basics
- Alphascope Polymarket Odds
- Phemex Academy
- Tenki Kelly Criterion
- Navnoor Bawa – Math of Prediction Markets
- Better Edge Kelly Guide
- YouTube: Prediction Markets Explained
- YouTube: How Betting Odds Work
The PolyPunter staff works tirelessly to bring you the latest and most insightful news, information, and tips on the fast-growing economic, financial, and social phenomenon that is prediction markets.