
Traders on leading platforms wager millions that tanker traffic through this critical shipping route will stay disrupted for months amid the ongoing Iran conflict. Bettors drive contract prices that signal deep skepticism about any quick recovery in maritime flows. The heavy betting activity underscores widespread concern about the sustained impact on global energy supplies and oil prices.
Market participants pour funds into contracts tied directly to transit volumes and normalization timelines. Their collective wisdom points to a slow return to pre-conflict levels of shipping activity. This sentiment gains traction as real-time data shows tanker movements reduced to a fraction of normal volumes.
Tanker Traffic Normalization Odds Reveal Extended Timeline for Recovery
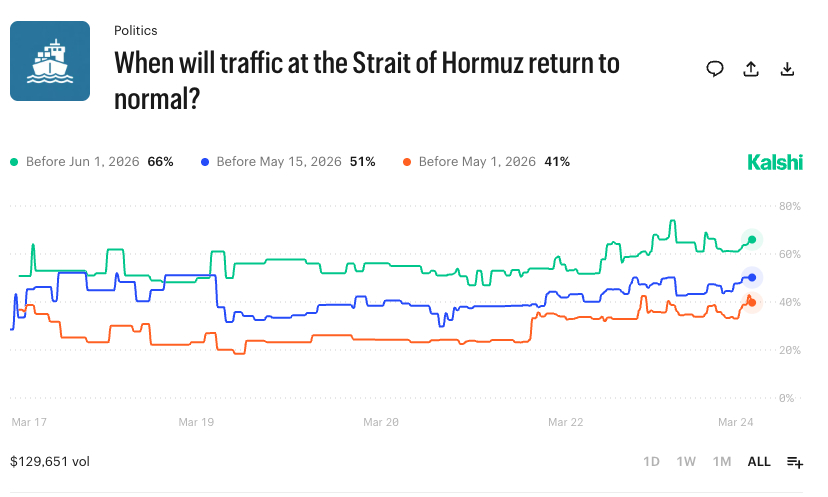
Bettors assign low probabilities to near-term normalization of tanker traffic in the vital waterway. Kalshi contracts show odds of less than 25 percent that traffic will return to normal before April 15. The same platform lists the chances rising to 67 percent by June 1 and to 76 percent by July 1.
Polymarket participants price in just 39 percent odds that traffic normalizes by the end of April. That figure dropped sharply from nearly 80 percent earlier this month. Traders adjust positions rapidly as fresh geopolitical developments unfold, and insurance costs soar.
These contracts attract hundreds of thousands in volume as participants seek to profit from precise timing predictions. The data from active markets reflects real money riding on the belief that shipping disruptions will persist well into the second quarter.
Current Prediction Market Odds on Strait of Hormuz Tanker Traffic Normalization
| Normalization Date | Kalshi Odds | Polymarket Odds | Trading Volume |
|---|---|---|---|
| Before April 15 | Under 25% | N/A | ~$100,000 |
| By End of April | ~35% | 39% | Over $1 million |
| By May 15 | 48% | N/A | High activity |
| By June 1 | 67% | ~53% | Significant |
| By July 1 | 76% | ~59% | Growing |
Shipping Volumes Plummet Amid Ongoing Maritime Disruptions
Real-time tracking confirms the dramatic collapse in tanker movements through the route. Daily transits fell 92 percent from pre-conflict averages exceeding 100 vessels. Only 21 tankers crossed the waterway since late February, according to S&P Global Market Intelligence data.
Hundreds of ships now cluster outside the area while crews remain stranded at sea for weeks. Insurance providers canceled coverage for many operators, forcing rerouting around Africa. These changes compound delays and raise fuel consumption for global supply chains.
Maritime analysts note that even minimal crossings carry elevated risks from potential strikes. The functional shutdown affects not only oil but also liquefied natural gas and other commodities. Bettors closely monitor IMF PortWatch figures to settle their contracts using seven-day moving averages.
This footage from Moneycontrol captures the sharp decline in vessel activity and illustrates the scale of the current shipping disruptions.
Oil Prices React Sharply to Sustained Supply Chain Pressures
Crude benchmarks climbed toward $80 per barrel immediately after traffic halted. Analysts warn prices could reach and sustain at $100+ if the route stays blocked for extended periods. Goldman Sachs highlights a potential 30 percent increase under prolonged closure scenarios.
Global energy markets absorb the shock as roughly 20 percent of daily world oil production once flowed through the strait. Asian buyers in particular scramble for alternative sources and accept higher costs. The situation forces producers to cut output because tankers cannot load cargo.
Bettors tie their shipping contracts to broader oil price movements and hedge positions accordingly. Their forecasts influence institutional trading desks that now incorporate market-derived probabilities into risk models. The interplay between prediction contracts and physical markets intensifies daily.
Impact of Shipping Disruptions on Key Oil Market Metrics
| Metric | Pre-Conflict Level | Current Level | Projected Duration Effect |
|---|---|---|---|
| Daily Tanker Transits | 100+ | 4-7 | Months if no resolution |
| Oil Price per Barrel | ~$70 | ~$80+ | Potential $100 spike |
| Stranded Vessels | Minimal | 240+ | Rising spill risks |
| Global Oil Flow Share | 20% | Near zero | Supply crunch persists |
Geopolitical Developments Fuel Uncertainty Around Maritime Shipping Recovery
Recent statements from involved parties suggest no immediate breakthrough on safe passage guarantees. Naval escorts remain under discussion, yet face logistical hurdles in the tense environment. Traders discount optimistic timelines and favor contracts that pay out later in the year.
Attacks on commercial vessels continue to deter operators even when sporadic crossings occur. Environmental groups raise alarms about oil-spill threats from immobilized tankers carrying billions of liters of crude. The human cost mounts as seafarers endure extended isolation aboard drifting ships.
Prediction market participants integrate these factors into pricing models that update in real time. Their aggregated bets provide a forward-looking gauge that often precedes official announcements. Market liquidity remains robust despite the volatility.
Analysts in this discussion examine the challenges facing efforts to restore safe tanker traffic through the route.
Broader Economic Ripples Extend from Persistent Shipping Disruptions
Supply chains for semiconductors, pharmaceuticals, and fertilizers suffer knock-on effects from rerouted vessels. Air cargo operators divert flights and absorb higher fuel expenses. European and Asian economies brace for elevated inflation as energy costs feed through to consumers.
Commodity traders monitor prediction market signals to adjust their futures positions in oil and related products. The contracts function as an early warning system for macro investors seeking an edge. Volume on related shipping and energy markets continues to set records.
Resolution hinges on diplomatic progress that bettors currently expect to take months. The data shows no rapid rebound in confidence even after high-level talks. Participants maintain a bearish stance on the quick normalization of tanker traffic.
Market Sentiment Solidifies Around Months-Long Timeline for Full Recovery
Bettors are demonstrating conviction by increasing exposure to longer-dated contracts on the waterway. Their positions reflect an analysis of historical precedents combined with current threat assessments. The wisdom of crowds in these markets often outperforms traditional forecasts during crises.
Stakeholders across the energy and shipping sectors now reference these probabilities in internal briefings. The transparent pricing mechanism provides a daily snapshot of the expected disruption duration. Traders who bet correctly stand to gain substantial returns while providing valuable signals to the wider economy.
Global energy security faces a stern test while the conflict simmers. Bettors continue to allocate capital based on the most probable paths forward. Their forecasts shape hedging strategies and investment decisions worldwide.
References
- CNBC: Strait of Hormuz traffic won’t return to normal for months
- Kalshi: When will traffic at the Strait of Hormuz return to normal?
- Polymarket: Strait of Hormuz traffic returns to normal by the end of April?
- CNBC: Traffic is trickling through the Strait of Hormuz
- Reuters: Iran war tanker traffic collapse visuals
- YouTube: Strait of Hormuz Traffic Collapses 97 Percent
- YouTube: Why Trump Has Failed To Reopen Hormuz Strait
- IMF PortWatch
- Windward: Strait of Hormuz traffic near collapse
The PolyPunter staff works tirelessly to bring you the latest and most insightful news, information, and tips on the fast-growing economic, financial, and social phenomenon that is prediction markets.